Logistic Regression
0. Visualizing the data
读取数据的代码
data = load('ex2data1.txt');
X = data(:, [1, 2]); y = data(:, 3);
ex2data1的内容
34.62365962451697,78.0246928153624,0
30.28671076822607,43.89499752400101,0
35.84740876993872,72.90219802708364,0
60.18259938620976,86.30855209546826,1
79.0327360507101,75.3443764369103,1
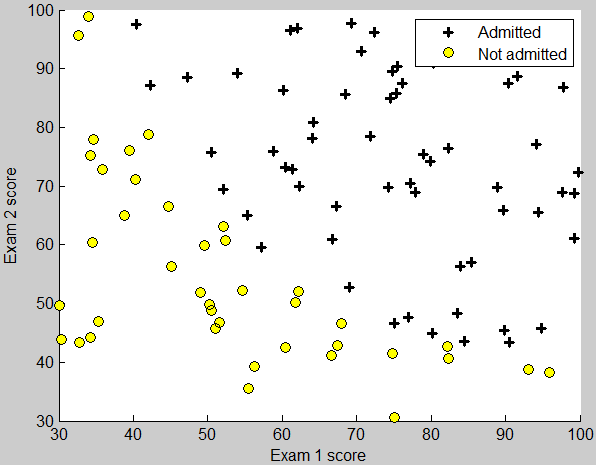
第一列是exam1的分数,第二列是exam2的分数,第三列是是否被录取。
这部分要求把已有的数据用散点图的形式画出。
录取的点用+表示,未录取的点用圆圈o表示。plotData函数的框架如下
function plotData(X, y)
	figure; hold on;
	%====================== YOUR CODE HERE ======================
	hold off;
end
此时X有两列,分别是exam1和exam2的分数。对应y等于1时,用+画点;y等于0时,用o画点。下面是一种通过循环的方式
m = length(y);
for i = 1 : m
    if y(i) > 0
        plot(X(i, 1), X(i, 2), 'k+', 'LineWidth', 2, ...
            'MarkerSize', 7);
    else
        plot(X(i, 1), X(i, 2), 'ko', 'MarkerFaceColor', 'y', ...
            'MarkerSize', 7);
    end
end
plot函数中的三个点号 … 是表示换行,为了避免一行太长。
但是这样有个问题,后面的代码中
 % Specified in plot order
legend('Admitted', 'Not admitted')
图示是按照plot的顺序出现的,由于plot了多次,导致图示不正确。下面是向量化的方法
pos = find(y == 1);
neg = find(y == 0);

plot(X(pos, 1), X(pos, 2), 'k+', 'LineWidth', 2, ...
    'MarkerSize', 7);
plot(X(neg, 1), X(neg, 2), 'ko', 'MarkerFaceColor', 'y', ...
    'MarkerSize', 7);
find()返回的是所有满足条件的下标。这样就不用循环了。
运行效果如图
1. sigmoid function
要求实现函数
$$g(z) = \frac{1}{1 + e^{-z}}$$
实现时z可能是向量,要对每个元素都做计算
function g = sigmoid(z)
    g = zeros(size(z));
    g = 1 ./ (1 + exp(-z));
end
2. Cost function and gradient
先来看一下计算前的准备工作
 %% ============ Part 2: Compute Cost and Gradient ============
 %  In this part of the exercise, you will implement the cost and gradient
 %  for logistic regression. You neeed to complete the code in
 %  costFunction.m

 %  Setup the data matrix appropriately, and add ones for the intercept term
[m, n] = size(X);

 % Add intercept term to x and X_test
X = [ones(m, 1) X];

 % Initialize fitting parameters
initial_theta = zeros(n + 1, 1);

 % Compute and display initial cost and gradient
[cost, grad] = costFunction(initial_theta, X, y);
X是个矩阵,它每列表示一个特征,每行表示一个实例。theta是n+1个元素的列向量。y是m个元素的结果向量。

代价函数公式
$$J(\theta) = – \frac{1}{m} \sum_{i = 1}^{m} \left( y^{(i)} log(h(x^{(i)})) + (1-y^{(i)}) log\left(1-h(x^{(i)})\right) \right)$$
可以先用一个变量hx求出h(x),利用1中的函数
$$ h(x) = \frac{1}{1 + e^{- \theta^T x}} $$$
hx = sigmoid(X * theta);
求和号中每一项对应一行,可以使用向量化的方法计算,最后用sum求和。
J = (-1/m) * sum(y .* log(hx) + (1-y) .* log(1 - hx));
梯度的计算公式
$$\frac{\partial}{\partial \theta_j} J(\theta) = \frac{1}{m} \sum_{i=1}^{m}\left( \left(h(x^{(i)}) – y^{(i)}\right) x_j^{(i)} \right)$$
最终的代码
function [J, grad] = costFunction(theta, X, y)
    m = length(y); % number of training examples
    grad = zeros(size(theta));

    hx = sigmoid(X * theta);
    J = (-1/m) * sum(y .* log(hx) + (1-y) .* log(1 - hx));

    n = length(theta);
    for j = 1 : n
        grad(j) = sum((hx - y) .* X(:, j)) / m;
    end
end
3. fminunc
关键代码如下
 %  Set options for fminunc
options = optimset('GradObj', 'on', 'MaxIter', 400);
 %  Run fminunc to obtain the optimal theta
 %  This function will return theta and the cost
[theta, cost] = ...
	fminunc(@(t)(costFunction(t, X, y)), initial_theta, options);
 % Plot Boundary
plotDecisionBoundary(theta, X, y);
fminunc中的@(t)(costFunction(t, X, y))是为了把函数costFunction转换为只接受一个参数t的函数。
调用plotDecisionBoundary函数画出点和决策边界,其中相关的代码如下(两个参数的情况)
if size(X, 2) <= 3
    % Only need 2 points to define a line, so choose two endpoints
    plot_x = [min(X(:,2))-2,  max(X(:,2))+2];

    % Calculate the decision boundary line
    plot_y = (-1./theta(3)).*(theta(2).*plot_x + theta(1));

    % Plot, and adjust axes for better viewing
    plot(plot_x, plot_y)

    % Legend, specific for the exercise
    legend('Admitted', 'Not admitted', 'Decision Boundary')
    axis([30, 100, 30, 100])
ex2的第104行是不需要的,因为在上面函数里已经添加了图示。在运行legend(‘Admitted’, ‘Not admitted’)反而会覆盖掉分界线的图示。
4. predict
通过3得出了参数,现在就可以预测了。我们有结论
\(\theta^T x > 0\)时,对应h(x) > 0.5,应该预测结果为1;
\(\theta^T x < 0\)时,对应h(x) < 0.5,应该预测结果为0;
因此代码为
function p = predict(theta, X)
    p = ((X * theta) >= 0);
end
Regularization
1. Visualizing the data
这部分使用的代码和上面的相同
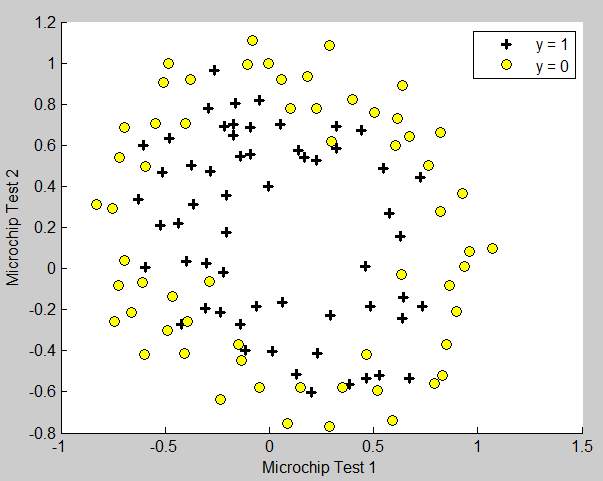
但这次的数据不能用直线来拟合出边界。
2. Feature mapping
使用已有的特征的幂来当做新的特征,这里最高6次幂。代码如下
function out = mapFeature(X1, X2)
 % MAPFEATURE Feature mapping function to polynomial features
 %
 %   MAPFEATURE(X1, X2) maps the two input features
 %   to quadratic features used in the regularization exercise.
 %
 %   Returns a new feature array with more features, comprising of
 %   X1, X2, X1.^2, X2.^2, X1*X2, X1*X2.^2, etc..
 %
 %   Inputs X1, X2 must be the same size
 %
degree = 6;
out = ones(size(X1(:,1)));
for i = 1:degree
    for j = 0:i
        out(:, end+1) = (X1.^(i-j)).*(X2.^j);
    end
end

end
3. Cost function and gradient
公式如下
$$J(\theta) = – \left[ \frac{1}{m} \sum_{i = 1}^{m} \left( y^{(i)} log(h(x^{(i)})) + (1-y^{(i)}) log\left(1-h(x^{(i)})\right) \right) \right] + \frac{\lambda}{2m} \sum_{j=1}^{n} \theta_j^2$$
theta_0和之前的相同,其余的参数在最后加了\(\frac{\lambda}{2m} \sum_{j=1}^{n} \theta_j^2\)
代码如下
    hx = sigmoid(X * theta);
    J = (-1/m) * sum(y .* log(hx) + (1-y) .* log(1 - hx)) + ...
        (lambda/(2*m)) * (sum(theta .* theta) - theta(1)^2);
要注意减掉theta(1)的平方,因为公式中不包含 \(\theta_0\),所以需要去掉。
梯度下降的算法公式
$$\frac{\partial}{\partial \theta_0} J(\theta) = \frac{1}{m} \sum_{i=1}^{m} \left(h(x^{(i)}) – y^{(i)}\right) x_0^{(i)} $$
$$\frac{\partial}{\partial \theta_j} J(\theta) = \left( \frac{1}{m} \sum_{i=1}^{m} \left(h(x^{(i)}) – y^{(i)}\right) x_j^{(i)} \right) + \frac{\lambda}{m}\theta_j$$
计算代码
function [J, grad] = costFunctionReg(theta, X, y, lambda)
	m = length(y); % number of training examples
	grad = zeros(size(theta));

    hx = sigmoid(X * theta);
    J = (-1/m) * sum(y .* log(hx) + (1-y) .* log(1 - hx)) + ...
        (lambda/(2*m)) * (sum(theta .* theta) - theta(1)^2);

    grad(1) = (1/m) * sum((hx - y) .* X(:, 1));
    n = length(theta);
    for j = 2 : n
        grad(j) = (1/m) * sum((hx - y) .* X(:, j)) + (lambda / m) * theta(j);
    end
end
4. plotDecisionBoundary
画出非线性边界的代码
else
    % Here is the grid range
    u = linspace(-1, 1.5, 50);
    v = linspace(-1, 1.5, 50);

    z = zeros(length(u), length(v));
    % Evaluate z = theta*x over the grid
    for i = 1:length(u)
        for j = 1:length(v)
            z(i,j) = mapFeature(u(i), v(j))*theta;
        end
    end
    z = z'; % important to transpose z before calling contour

    % Plot z = 0
    % Notice you need to specify the range [0, 0]
    contour(u, v, z, [0, 0], 'LineWidth', 2)
end
5. change regularization parameters
修改ex2_reg.m第90行可以修改lambda的大小,等于0对应不进行正则化。

 支付宝打赏
支付宝打赏  微信打赏
微信打赏
請問我第一個照著你的做但我的塗上無法同時出現黃色跟黑色的圖示
请问这个predict函数中,是得到验证集等于训练集的比例的意思吗?那么这个里面准确率是80几是不是表示得到的模型不对呢,这个准确率应该是100才对呢?验证集等于训练集这个算犯规呢,如果准确率不等于一百有什么意义呢?
准确率不是100%啊 因为这里用一条直线来分的 所以会有一些点是错误的 你看ex2.pdf的第7页的图
谢谢,非常棒! 请问其他周的作用有吗?想多学习下。
很棒。在学这个课,解决了一些困惑
谢谢评论 很高兴帮到你